The Great Restrictor: Mastering Resistance & Ohm's Law
Stop burning out your LEDs. Master electrical resistance, Ohm's Law calculations, and build your first protected circuit in Day 3 of our Electronics series.
Read More →
* SYSTEM.NOTICE: Affiliate links support continued laboratory research.
Welcome to the darkest hour of the hardware journey: the silent fail.
In the software world, we are spoiled by the luxury of communication. When your code crashes, the runtime environment usually has the decency to tell you why. You get a NullPointerException, a segmentation fault (if you’re feeling adventurous), or at the very least, a log entry in /var/log/syslog. You have a stack trace that points a decisive finger at the exact line of code where your logic collapsed. You have “breakpoints,” “watch expressions,” and the ability to step through time itself.
In hardware, there is no stack trace. There is no debugger; statement. There is only a physical object that is stubbornly refusing to do what you want. Your LED isn’t blinking, your sensor is returning 0, and the only “output” you have is a distinct lack of photons.
As a software developer, this is terrifying. It feels like trying to debug a production outage on a server where SSH is disabled, logs are piped to /dev/null, and the only way to inspect state is to probe the physical traces on the motherboard with a needle.
But here is the secret: Hardware debugging isn’t magic. It’s not a dark art reserved for gray-bearded engineers in lab coats. It’s just a different set of sensors. Today, we are going to learn how to “Inspect Element” on the physical world. We are going to build your Hardware Debugging Mental Model and turn those silent fails into actionable data.

When you debug code, you are auditing the Path of Logic. You are tracking how a variable changes across functions. When you debug hardware, you are auditing the Path of Energy.
In software, a bug is usually a “wrong instruction.” In hardware, a bug is usually a “wrong physical state.” Electrons are incredibly predictable; they don’t have “off days” or “race conditions” in the same way software does (at least not in the beginner stages). If an electron has a path to Ground and the pressure (Voltage) is high enough, it will move.
If your circuit isn’t working, it’s almost always due to one of four “Physical Logic Errors”:
Before you touch a single wire, ask yourself: “Where is the energy supposed to be going, and what is blocking it?”
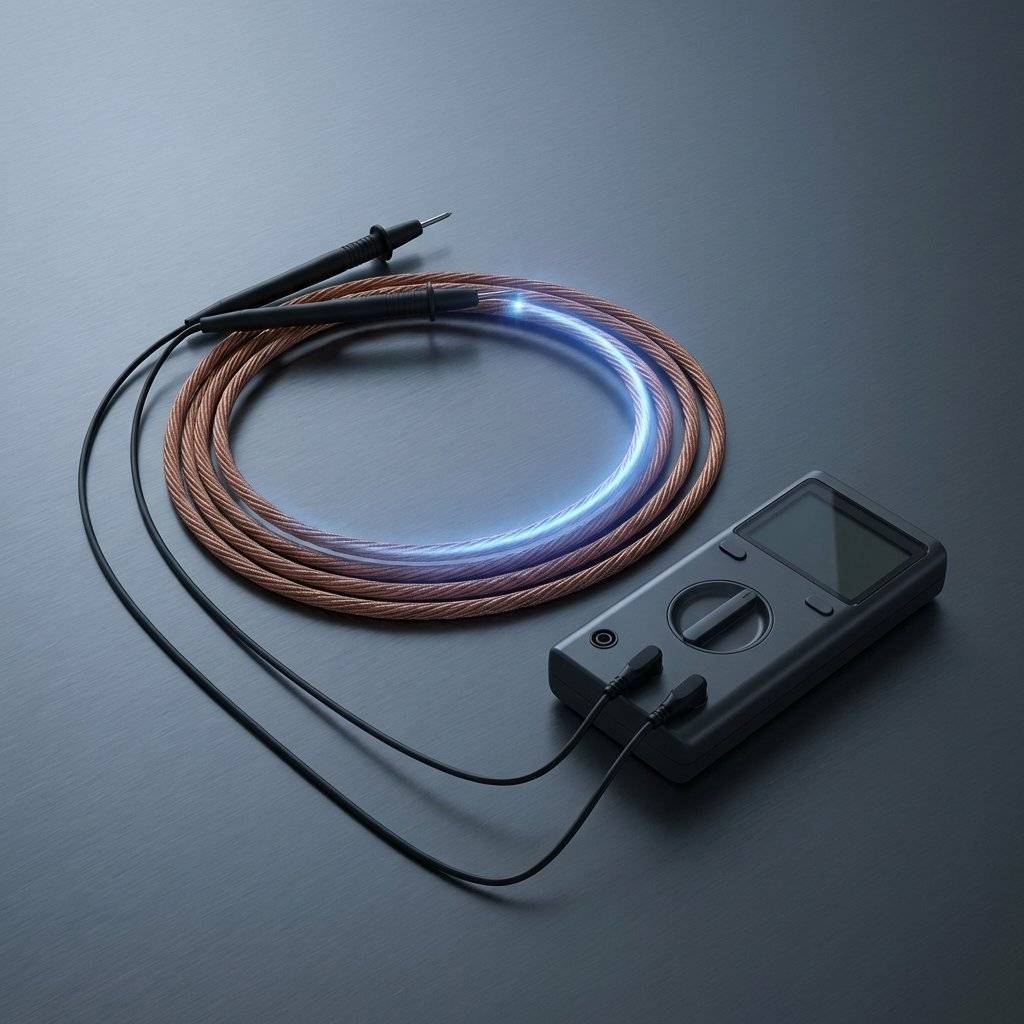
If VS Code is your software IDE, the Multimeter is your hardware IDE. It allows you to peer into the “Variables” of your circuit. Without it, you are coding blind.
In software, you might do console.log(myVar). In hardware, you touch your multimeter probes to a pin and Ground.
true (Logic HIGH).false (Logic LOW).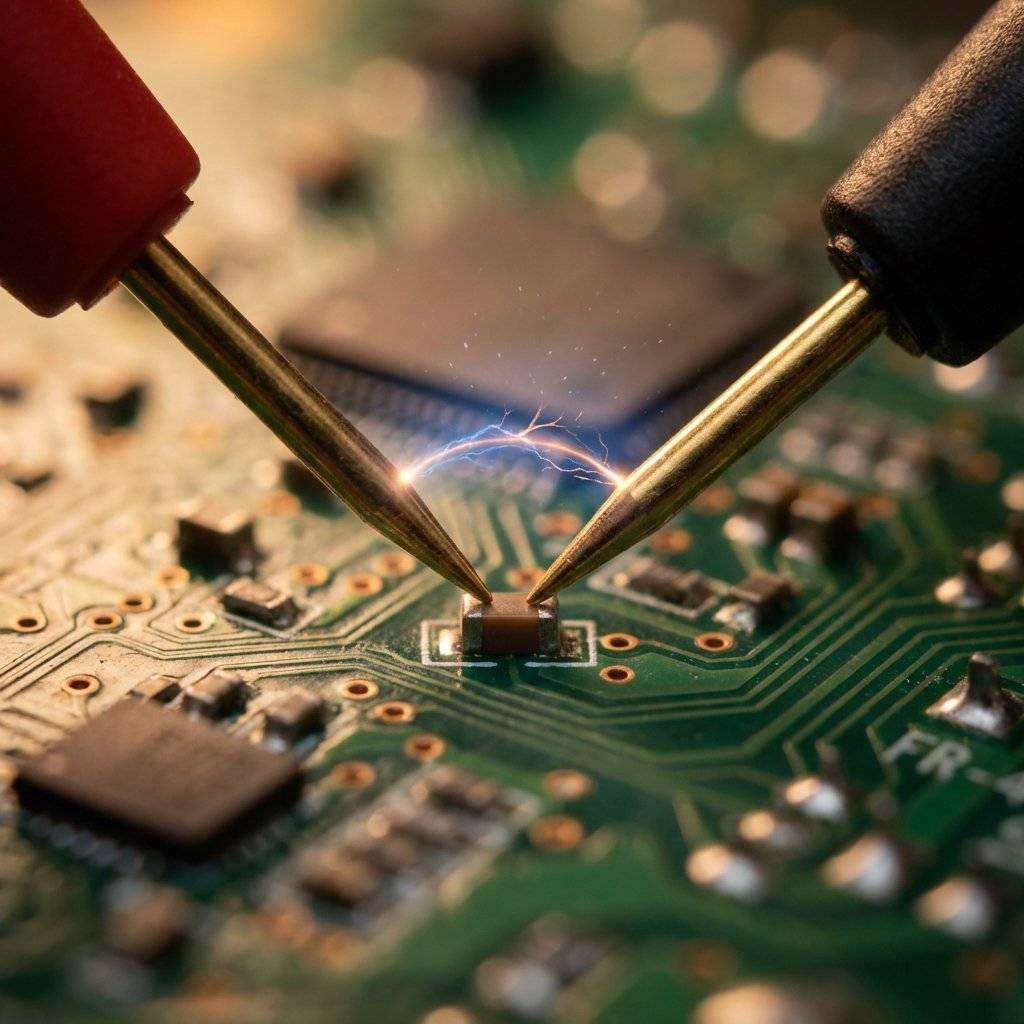
This is the single most useful tool in your kit. Set your multimeter to the icon that looks like a sound wave. When you touch the probes together, it beeps.
This is the hardware equivalent of a ping.
Pro-Tip for Devs: Always run a continuity test on your power rails before you plug in the USB. If it beeps between Red and Black rails, you have a short. Fixing it now saves your laptop’s motherboard from a “Hardware Kernel Panic.”
Understanding hardware errors is easier if you map them to concepts you already know.
An open circuit is a broken connection. A jumper wire that looks plugged in but is actually loose. A resistor with a cracked leg. A cold solder joint.
undefined is not a function or a broken pointer. The logic path simply doesn’t exist.A short circuit is a zero-resistance path from Power (VCC) to Ground (GND). It consumes all available current instantly, bypassing your components.
while(true) loop that consumes 100% CPU and makes the fans scream until the system throttles.This is the most frustrating bug for developers. You have a button connected to an Arduino pin. Sometimes it reads HIGH, sometimes LOW, even when you aren’t touching it. It seems to react to your hand moving nearby.

In software, when we find a bug in production, we might push a “hotfix” or use a “monkey-patch” to override a function at runtime. In hardware, we have the Bodge.
A bodge is a physical modification made to a circuit after it has been built. If you designed a PCB and accidentally swapped the TX and RX lines (the hardware version of a variable name swap), you don’t throw the board away. You perform “surgery.”
goto statement—ugly, but effective in an emergency.Mindset: Don’t be afraid to bodge. Every great engineer has a board with “scars.” These scars are evidence of a successful debug session.
As your projects get more complex, you’ll encounter bugs that aren’t caused by your code or your wiring, but by the Environment.
If you have two different power supplies (say, a wall wart for a motor and a USB for the Arduino) and they don’t share a Common Ground, you create a “Potential Difference.” This can cause erratic behavior, resets, and even destroyed components.
At low speeds (like a blinking LED), a wire is a wire. At high speeds (like a SPI bus), a wire becomes an Inductor and the space between wires becomes a Capacitor.

You don’t always need to touch physical probes to debug. Lean on your software background.
Inside the Arduino IDE, go to Tools -> Serial Plotter. If you use Serial.println(variable), the IDE will draw a real-time graph of that value.
Before you burn out a real $10 sensor, build it in a simulator.
The Problem: A developer built a simple counter. Every time they pressed a button, the count increased by 3 or 4 instead of 1.
The Software Assumption: “My count++ logic is broken. Maybe there’s a loop issue?”
The Hardware Truth: Contact Bounce. When a physical button closes, the metal plates literally “bounce” for a few milliseconds, creating dozens of tiny on/off signals before settling.
The Fix: Debouncing. Either add a small capacitor (Physical Filter) or a delay(50) in your code (Software Filter) to ignore the noise.
The Problem: A developer was building a motor controller for a small robot. They were using a 12V LiPo battery. While probing the circuit with a multimeter, they accidentally slipped, and the probe bridged two pins. A small puff of smoke appeared, and the Arduino died instantly. The Software Assumption: “I can’t believe I didn’t write a safer driver. Did my PWM code cause a short?” The Hardware Truth: Physical Short Circuit. Probes are sharp and conductive. Bridging directly to a logic pin is a “Terminal Exception.” The Fix: Use Grabber Hooks instead of sharp probes for live circuits. And always, always double-check your probe placement before applying power.
The Problem: A project worked perfectly on the developer’s desk, but when they moved it to the kitchen counter near a microwave, it started resetting randomly.
The Software Assumption: “There must be a bug in my setup() function that’s being triggered intermittently.”
The Hardware Truth: Noise on the RESET pin. The Reset pin on many microcontrollers is active LOW and has a high impedance. The electromagnetic noise from the microwave was “tricking” the chip into thinking the reset button had been pressed.
The Fix: A stronger External Pull-up Resistor () on the RESET pin to “lock” it to , making it much harder for ambient noise to trigger a reset.
If you’re building a “War Room” for hardware, here is exactly what you need in your inventory:
Even the best of us get stuck. When you’ve checked every wire and measured every voltage and it still doesn’t work, lean on the community.
As a dev, you’re used to REST APIs or gRPC. In hardware, most of your component communication happens over I2C (Inter-Integrated Circuit). It’s a two-wire bus: SDA (Data) and SCL (Clock).
Every I2C device has a 7-bit address hardcoded into its silicon. If you use $0x76$ in your code but the sensor is $0x77$, you get a “Connection Refused”
2. Missing Pull-up Resistors: I2C is “Open Drain,” meaning the devices can only pull the lines LOW. You need physical resistors to pull them HIGH. If your SDA/SCL lines are sitting at 0V, the bus is “deadlocked.”
3. The “Bus Hang”: If a slave device resets in the middle of a transmission, it might hold the SDA line LOW forever. The Arduino will wait forever for the line to go HIGH. This is a physical “Infinite Loop.”
* The Fix: A “Bus Reset” function that manually toggles the Clock pin 9 times to “clear” the slave’s internal state machine.
In software, you might use gdb or the VS Code debugger to set a hardware breakpoint directly on the CPU. In the advanced hardware world, we have JTAG (Joint Test Action Group).
JTAG is a 4 or 5-pin interface that allows you to “halt” the physical CPU of your microcontroller. You can then inspect every single register, step through assembly instructions, and even rewrite the flash memory on the fly.
If JTAG is the protocol, In-Circuit Debugging (ICD) is the experience. Using tools like the Atmel-ICE or the ST-Link, you can see your variables update in real-time as the physical hardware executes.
sensorValue as the physical voltage changes.HardFault), the ICD will show you exactly which function caused the mess.Pro-Tip: If you’re coming from a high-level language like Python, ICD feels like magic. It bridges the gap between the “Code” and the “Copper.”
As a dev, you’re used to preventing crashes with try-catch blocks. In hardware, a “crash” often involves smoke. We use physical components to “handle exceptions” before they destroy the hardware.
When you turn off a motor or a relay, the magnetic field collapses and sends a massive voltage spike back into your circuit.
If your circuit pulls too much current, your power supply might overheat or shut down.
Integrated circuits need a constant, stable voltage. But power supplies can be “noisy.”
In software, your bits are protected by ECC memory and checksums. In hardware, your “bits” are just pulses of electricity flying through unshielded copper wires. These wires act as antennas.
At high speeds, a wire isn’t just a path; it’s a Transmission Line. If your wires are too long, the signals can actually “bounce” back from the end of the wire, creating reflections that confuse the receiver.
When debugging a system as complex as a computer, we tend to jump to complex conclusions. “Is it the compiler? Is it the kernel?”
In hardware, always assume the simplest physical failure first.
To help you speak the language of the lab, here are the terms you’ll hear most often:
Optional<Boolean> that is None.true.Hardware isn’t “harder” than software; it’s just “heavier.” It has mass, thermal limits, and physical presence. In software, a bug is an annoyance—a hurdle between you and a “merged” state. In hardware, a bug is a riddle. It challenges your understanding of the universe.
There is a specific feeling—a distinct “ping” in the brain—when you finally find that one loose wire or that one reversed diode. It is deeper than the feeling of a successful deployment or a passing test suite. It is the realization that you have successfully negotiated with the fundamental forces of physics to execute your logic.
By learning to debug hardware, you aren’t just becoming better at electronics. You are becoming a Full-Stack Engineer of Reality. You understand that the machine isn’t just a box of magic; it’s a series of measurable, verifiable, and fixable physical systems.
Next time your circuit fails, don’t get frustrated. Smile. You’ve just been handed a puzzle that the IDE can’t solve for you. Stay curious, stay grounded, and never stop probing.
For the developers who want to go deeper, there is the Oscilloscope. If a multimeter shows you the “Static Variable Value,” an oscilloscope shows you the “High-Frequency Log.” It plots Voltage over Time at a resolution of nanoseconds.
Many bugs are invisible to a multimeter because they occur too fast.
An oscilloscope is the ultimate hardware Profiler. It shows you the performance bottlenecks of your physical signals.
Q: Can I debug a circuit while it’s powered on? A: Yes, for voltage measurements. But NEVER perform a continuity test on a powered circuit. Sending the multimeter’s internal battery voltage into a powered circuit can blow the meter’s internal fuse or, worse, damage your Arduino pins.
Q: My Multimeter shows 0.01V instead of 0V. Is that a bug? A: That’s “Ground Noise.” In the real world, is rarely exactly . Anything below 0.1V is effectively Ground for most digital logic. Don’t chase millivolts unless you’re doing precision analog work.
Q: Why does my Arduino reset when I touch a wire? A: Static electricity (ESD). You are essentially “injecting” a massive voltage spike into the system. Use an anti-static mat, or at the very least, touch a grounded metal object (like your computer chassis) before working on your circuit.
Q: Is there a “Visual Studio Code” for hardware? A: Tools like Wokwi or Tinkercad Circuits are physical simulators. They are great for catching “Logic Errors” before you buy the actual atoms.
Q: How do I know if a chip is permanently dead? A: The “Magic Smoke” check. If it smelled bad, it’s likely gone. If it gets burning hot the moment power is applied, it’s dead. If it looks fine but doesn’t respond to simple tests, try it in a different circuit. Silicon is remarkably tough until it isn’t.
Before you close this tab and head to your workbench, I have a challenge for you. It’s a simple exercise to build your hardware debugging muscle memory.
Hardware isn’t “harder” than software; it’s just “heavier.” It has mass, thermal limits, and physical presence. In software, a bug is an annoyance—a hurdle between you and a “merged” state. In hardware, a bug is a riddle. It challenges your understanding of the universe.
There is a specific feeling—a distinct “ping” in the brain—when you finally find that one loose wire or that one reversed diode. It is deeper than the feeling of a successful deployment or a passing test suite. It is the realization that you have successfully negotiated with the fundamental forces of physics to execute your logic.
As software developers, we often forget that our code is just a series of instructions for moving energy around. When you debug hardware, you aren’t just fixing a circuit; you are learning to respect the physics that make your software possible. The journey from “Pixels” to “Atoms” is a long one, but it is the most rewarding transition a developer can make. It transforms you from a “User” of machines into a “Builder” of systems.
Next time your circuit fails, don’t get frustrated. Smile. You’ve just been handed a puzzle that the IDE can’t solve for you. By learning to debug hardware, you aren’t just becoming better at electronics. You are becoming a Full-Stack Engineer of Reality. You understand that the machine isn’t just a box of magic; it’s a series of measurable, verifiable, and fixable physical systems.
Stay curious, stay grounded, stay safe, and may your multimeters always beep when they should.
Copyright © 2026 TechnoChips. Open Source Hardware (OSHW).

Stop burning out your LEDs. Master electrical resistance, Ohm's Law calculations, and build your first protected circuit in Day 3 of our Electronics series.
Read More →
Understand electrical current like a pro. From drift velocity to safety, master the flow of electrons in Day 2 of our Analog Electronics series.
Read More →
Demystify voltage once and for all. Explore the physics, history, and practical measurement of electrical potential in this deep-dive guide for analog electronics beginners.
Read More →