Robotic Muscles: Master Arduino Servo Motors (SG90) for Precision Movement
Turn your Arduino into a robotics controller. Master the SG90 Servo Motor, understand closed-loop control systems, and build precise robotic joints.
Read More →
* SYSTEM.NOTICE: Affiliate links support continued laboratory research.
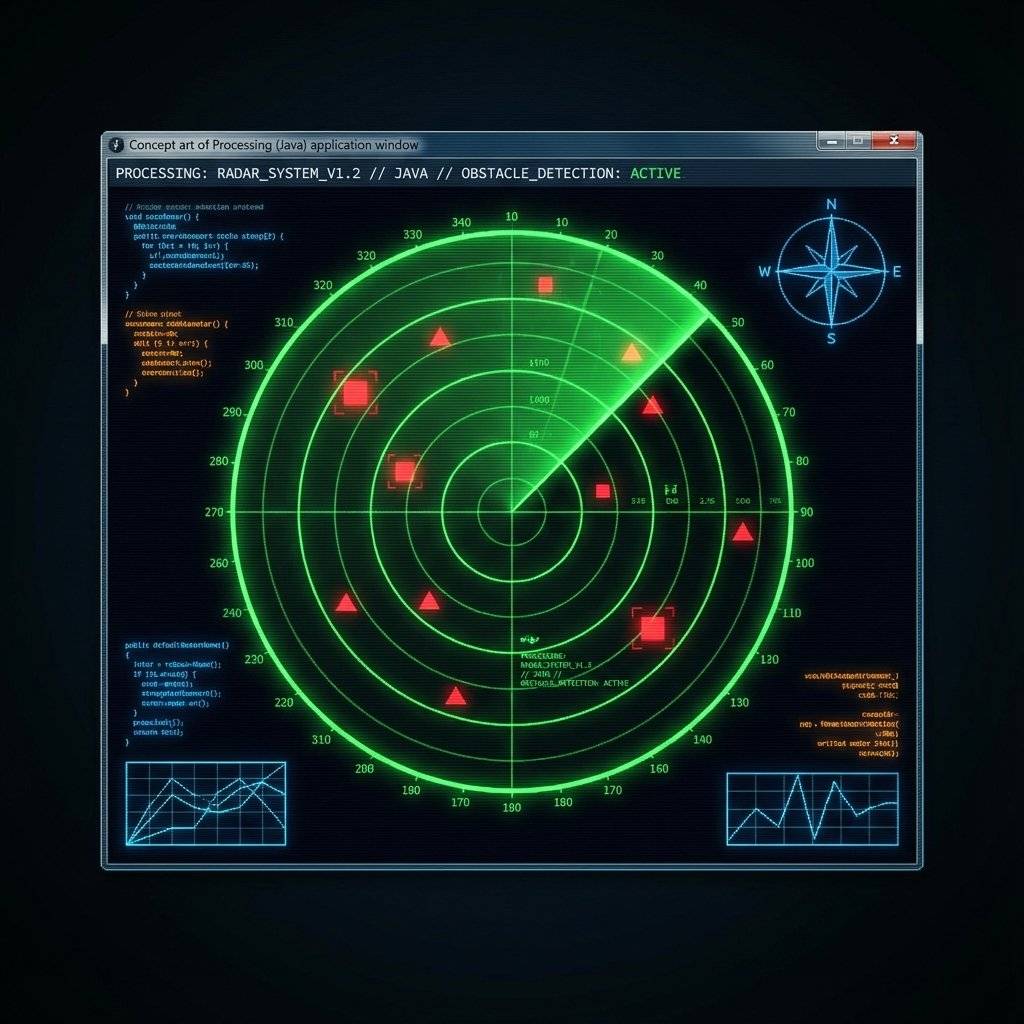
Today, we combine them. We are not just blinking an LED. We are building a System. We are building a Scanning Radar Station. This project mimics the technology used in submarines (SONAR) and airports (RADAR). It will physically sweep a sensor back and forth, map the room, and send that data to your computer to generate a visual map of the invisible world.
We are building a device that:
Yesterday, our sensor was a “flashlight”. It only saw what was directly in front of it. If a wall was to the left, the robot was blind to it. By mounting the sensor on a Servo, we turn that flashlight into a Lighthouse. We gain a 180-degree Field of View (FOV).
This is our most complex build yet. You will need:
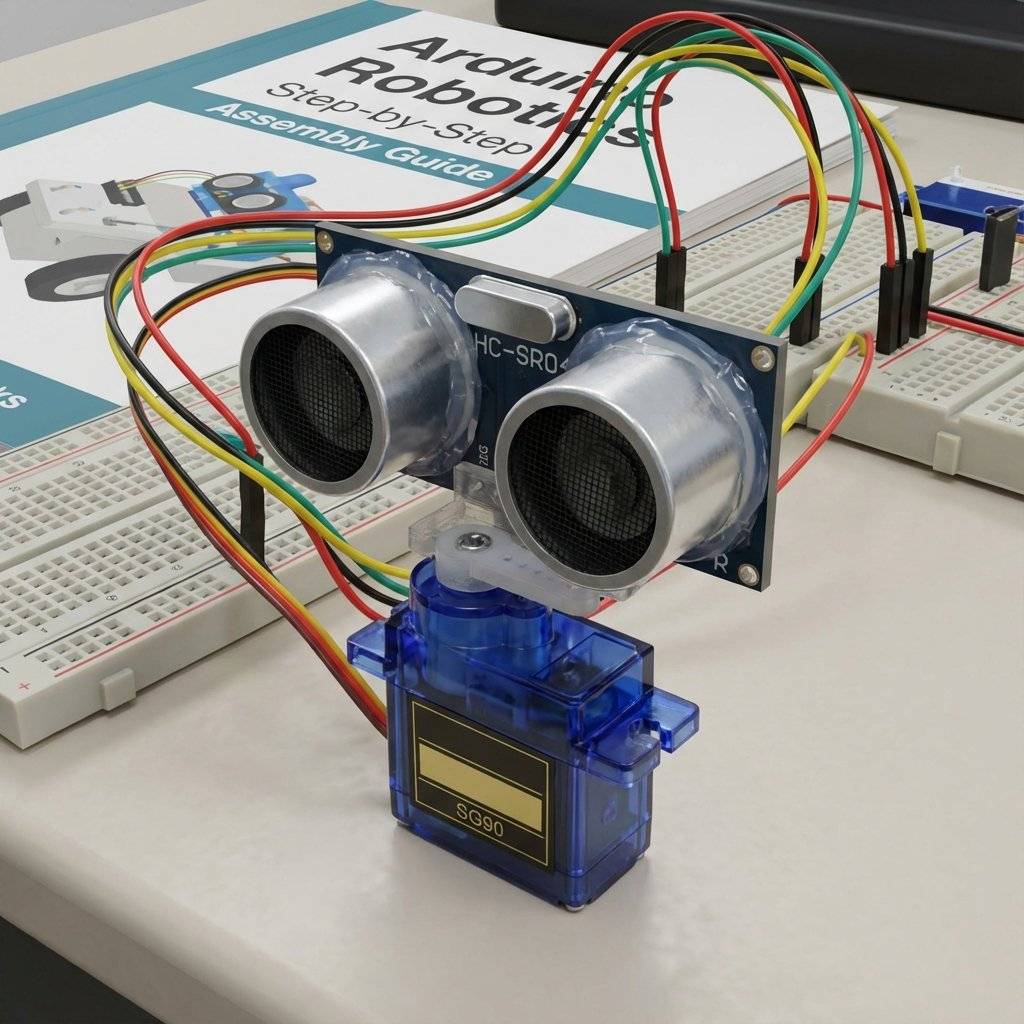
You can 3D print a bracket, or use the “Maker’s Glue”: Double Sided Tape. Stick the HC-SR04 directly onto the plastic horn of the servo. Ensure the servo can rotate freely without the wires getting tangled.
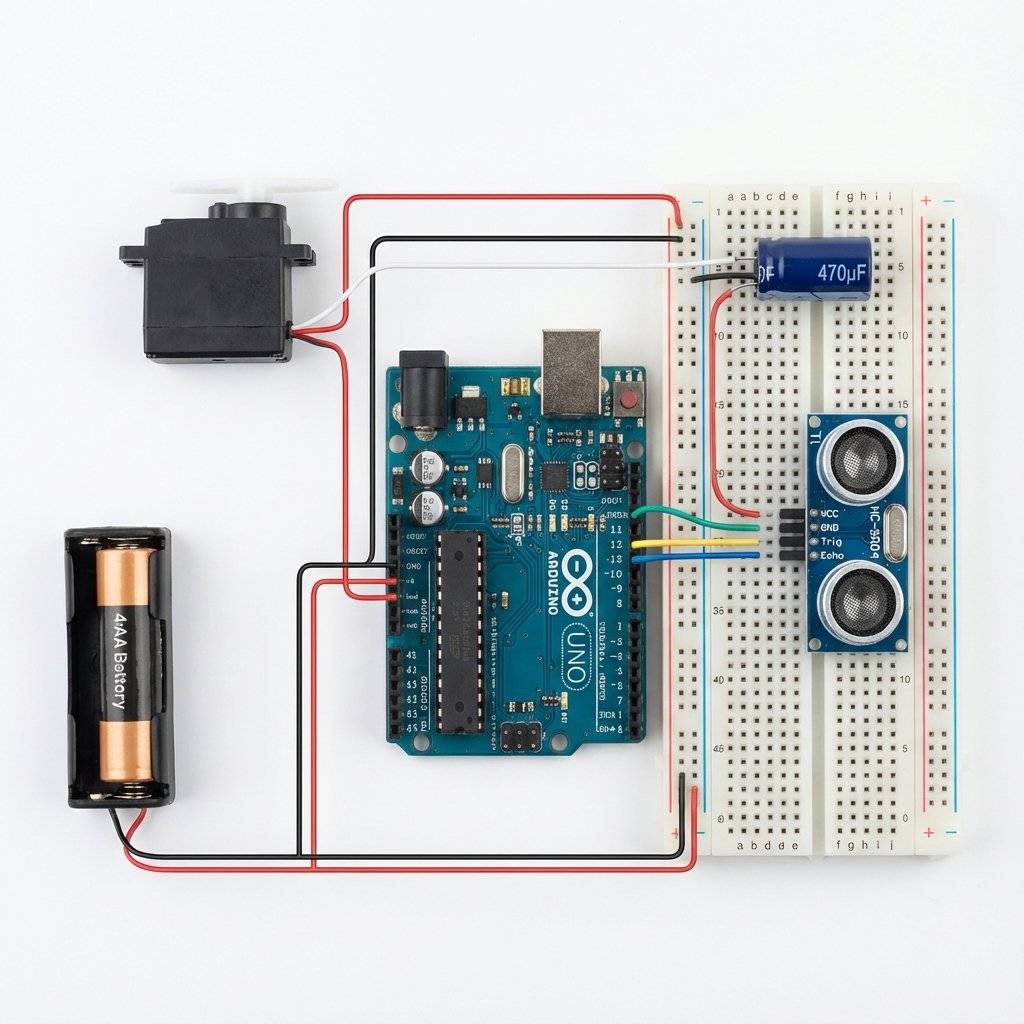
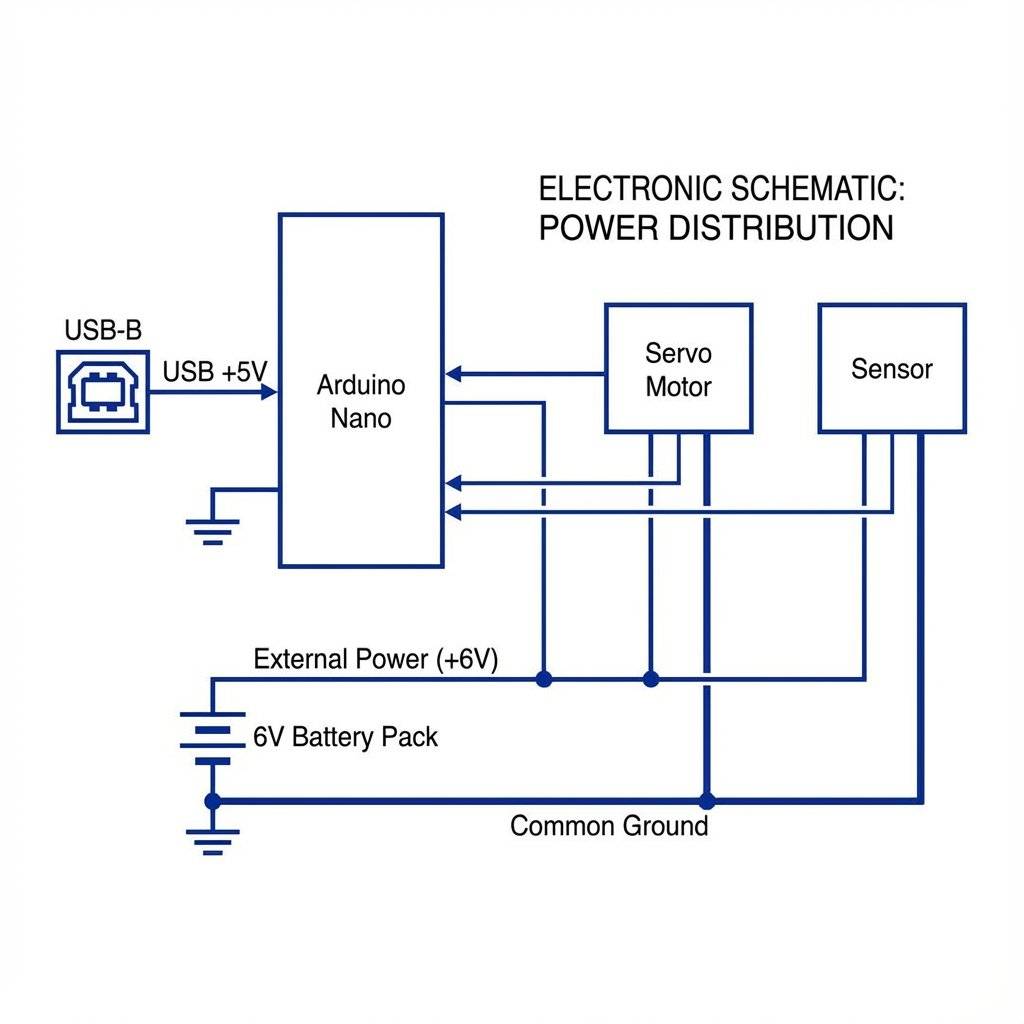
We are combining the wiring from Day 21 and Day 22. CRITICAL: We now have TWO power-hungry devices. The Servo draws current when moving. The Sensor draws current when pinging. If you try to power both from the Arduino 5V pin, you might get Noise or Brownouts.
Pinout:
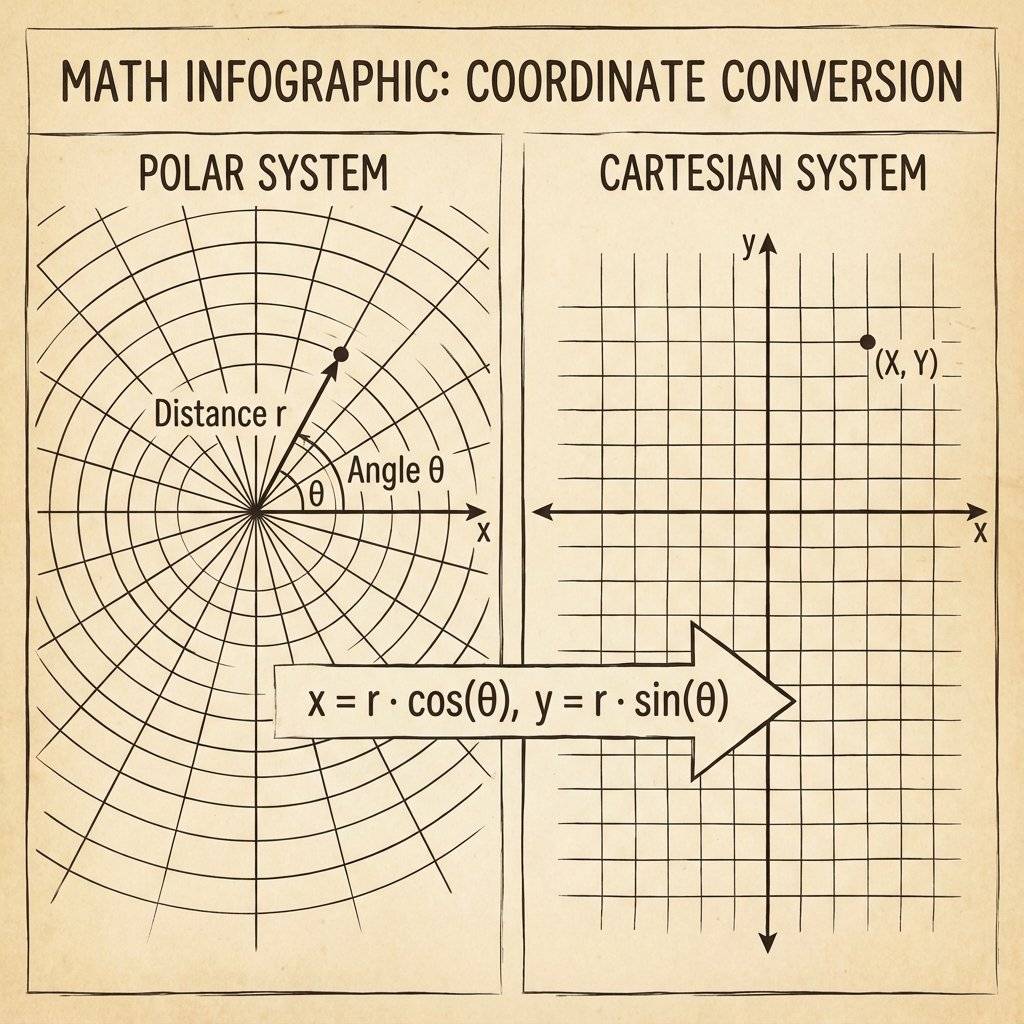
This is where High School Math finally becomes useful. The sensor gives us two numbers:
This is called the Polar Coordinate System. But computers screens (and graph paper) use the Cartesian Coordinate System (X, Y). To plot a dot on the screen, we need to convert Polar to Cartesian.
The Formula:
Note: Arduino’s sin() and cos() functions expect Radians, not Degrees. We must convert using the radians() helper.
We need a loop that:
#include <Servo.h>
#include <NewPing.h>

#define TRIG_PIN 10
#define ECHO_PIN 11
#define MAX_DIST 200 // Max distance 200cm

Servo radarServo;
NewPing sonar(TRIG_PIN, ECHO_PIN, MAX_DIST);

void setup() {
  Serial.begin(9600); // Fast communication
  radarServo.attach(9);
}

void loop() {
  // Sweep from 15 to 165 degrees
  // We avoid 0 and 180 as they often stretch the wires too much
  for (int i = 15; i <= 165; i++) {
    radarServo.write(i);
    delay(30); // Speed of rotation. Smaller = Faster
    // Calculate distance
    int distance = sonar.ping_cm();
    // Print for the Plotter: "Angle,Distance"
    Serial.print(i);
    Serial.print(",");
    Serial.println(distance);
  }
  // Return Sweep
  for (int i = 165; i >= 15; i--) {
    radarServo.write(i);
    delay(30);
    int distance = sonar.ping_cm();
    Serial.print(i);
    Serial.print(",");
    Serial.println(distance);
  }
}Why did I use delay(30)? Can we go faster?
Let’s do the math.
Speed of Sound: 343 m/s (34,300 cm/s).
Max Distance: 200 cm (Round trip = 400 cm).
Time of Flight: seconds (11 ms). If we ping every 5 ms, the previous echo might return while we are listening for the current ping. This creates “Ghost echoes”. We must wait at least 20-30 ms between pings to let the air “clear”. Maximum Scan Rate:
30ms per degree x 180 degrees = 5400 ms (5.4 seconds per sweep). If you scan faster, your data becomes garbage. Physics has a speed limit.
millis())The code above uses delay(), which freezes the Arduino.
If you want your robot to drive while scanning, you must use millis().
We will master this in Phase 5, but the concept is:
currentMillis.lastPingTime:lastPingTime.
This allows the loop() to run thousands of times per second, checking other sensors in between radar pings.Upload the code.
Open Tools > Serial Plotter.
You won’t see a Radar Map yet. You will see a temporal graph.
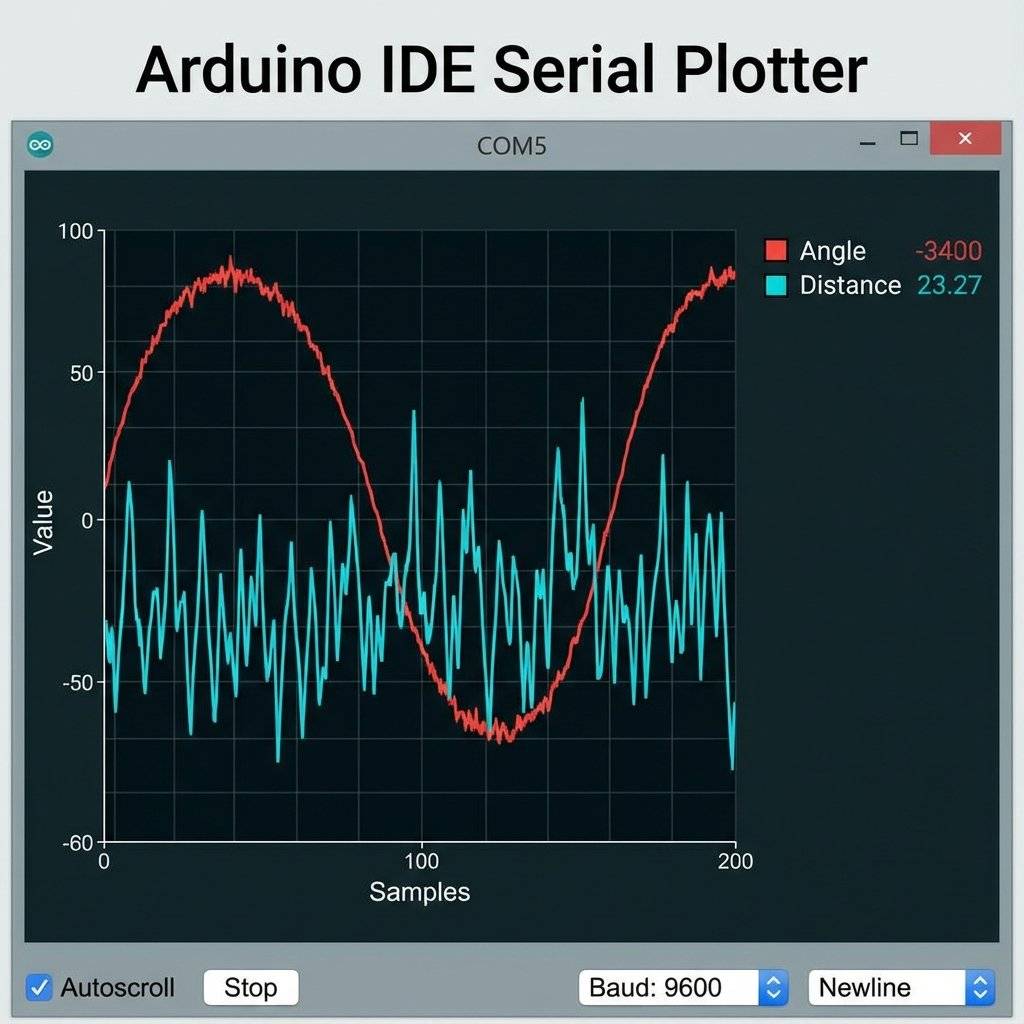
The Serial Plotter is a “dumb” tool. It listens for numbers separated by commas or spaces.
Serial.println(50); -> Draws 1 line at Y=50.Serial.print(10); Serial.print(","); Serial.println(50); -> Draws 2 lines (Y=10, Y=50).How do we get the “Cool Sci-Fi Radar Screen” (like the first image)? The Arduino cannot display complex graphics. We need to offload the rendering to a powerful computer. Data Flow Architecture:
Angle,Distance\n).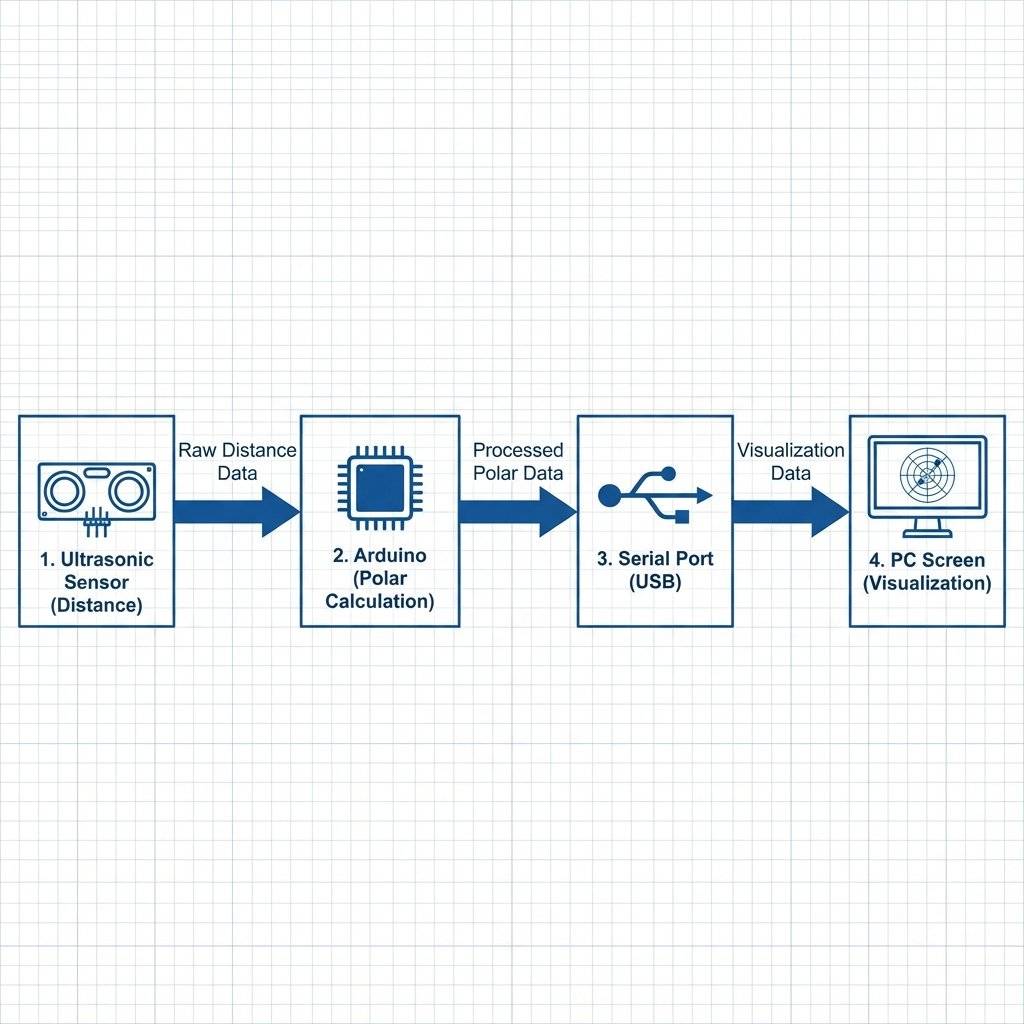
For years, the go-to tool for Arduino visualization has been Processing. It is a Java-based coding environment built for visual arts. It has a Serial library that can read the Arduino’s output. Writing a Processing sketch to draw a fading green radar line is a classic project. We will cover Processing in depth in Phase 6 (Interfacing).
Even though we haven’t learned Processing yet, here is the logic you would write in Java:
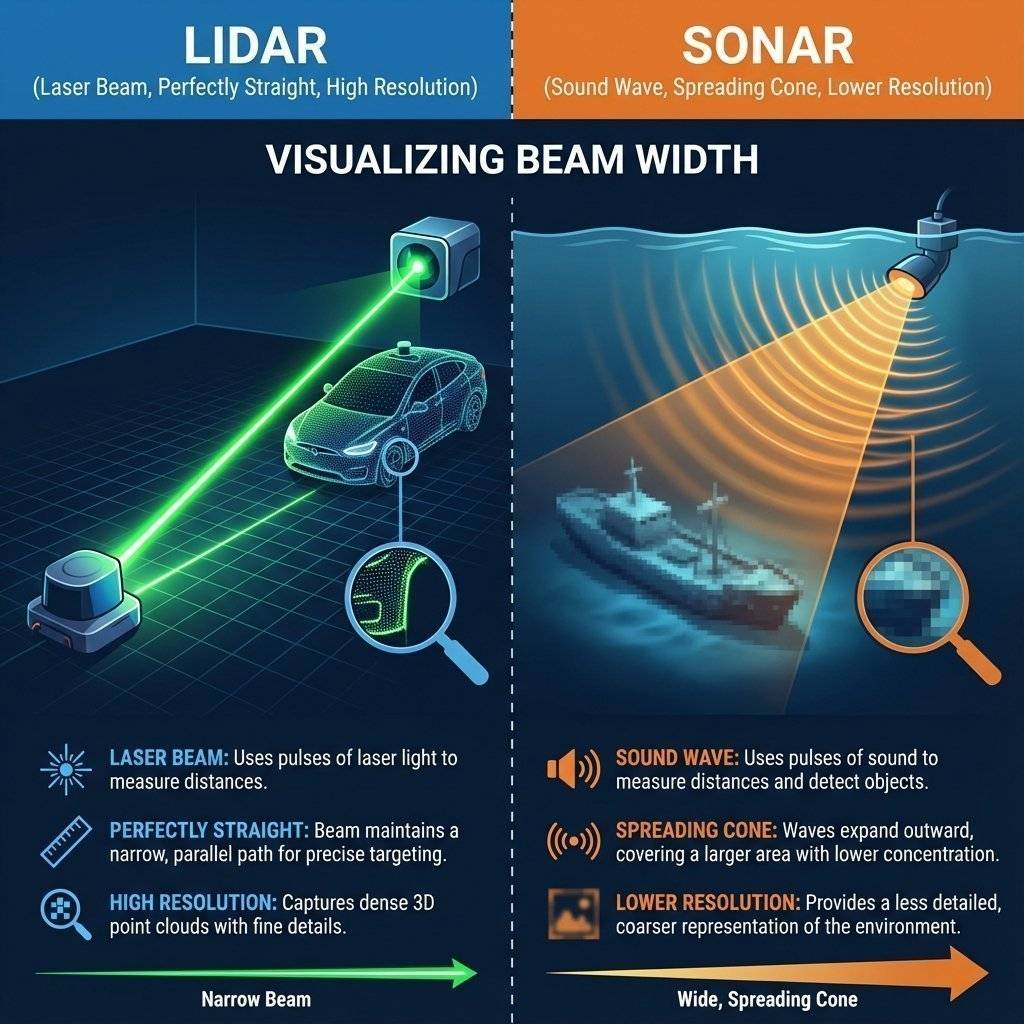
Angle, Distance).Why did we use Sound? Why not Light?
For a hobby robot, Ultrasonic is cheap and easy. But its Beam Width (15 degrees) means everything appears blurry and larger than it is.
We treat the Speed of Sound as a constant (343 m/s). But in Day 21, we learned it changes with air temperature. In a Radar application, accuracy matters. Speed =
Try this experiment:
I mentioned this in the wiring section, but it is the #1 cause of failure in this project. If you use a battery for the servo and USB for the Arduino… YOU MUST CONNECT THE NEGATIVE TERMINALS TOGETHER. Electricity needs a return path. Without a Common Ground, the Servo Signal (which is relative to Arduino Ground) means nothing to the Servo (which is relative to Battery Ground). The servo will jitter or do nothing. Always tie the grounds.
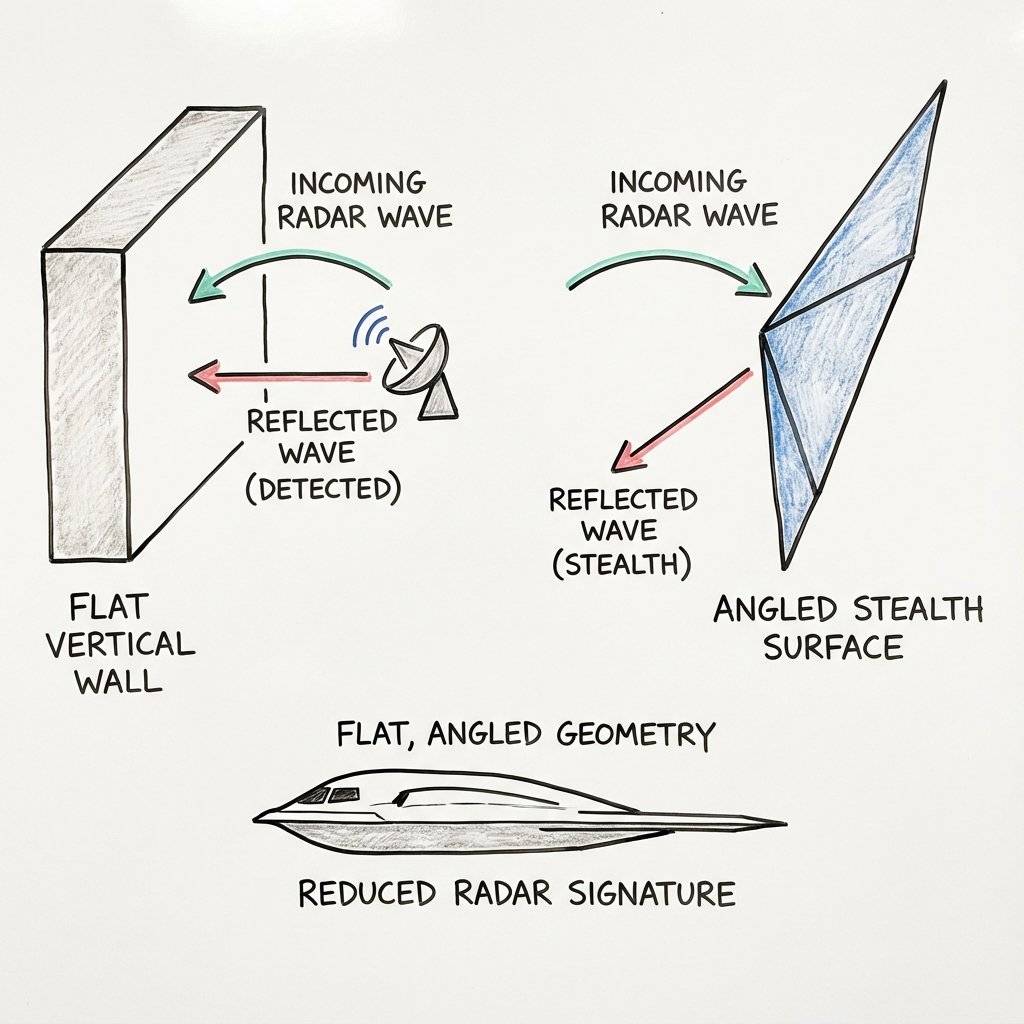
In a real room, you might see “Ghost Objects” that don’t exist. Why?
Radar (Radio Detection and Ranging) changed the world in 1940. The Royal Air Force (RAF) built a chain of radar towers (“Chain Home”) along the coast. They could see German bombers gathering over France, 100 miles away. This allowed the RAF to scramble their Spitfires exactly where they were needed, instead of patrolling randomly. It was the first time in history that humans extended their vision beyond the horizon. Your little robot is a tribute to that technology.
Why can’t our robot see the carpet? Sound behaves like light.
Right now, you need a PC to see the map. How can we make it portable?
| Component | Quantity | Value | Notes |
|---|---|---|---|
| Arduino Uno | 1 | Any | The Brain. |
| HC-SR04 | 1 | Ultrasonic | Distance sensor. |
| SG90 Servo | 1 | 9g | For sweeping the sensor. |
| Capacitor | 1 | 1000µF | Power smoothing. |
| Battery Pack | 1 | 4xAA | Recommended for reliability. |
| Breadboard | 1 | Half | Prototyping. |
You have built a perceive-act system. Your Arduino is no longer just blinking; it is sensing spatial data. This represents the end of the “Components” phase. We have covered Input (sensors), Output (displays, motors), and Logic.
Next, we start Advanced Communication. We are going to learn how chips talk to each other.
I2C: The 2-wire network.
SPI: The high-speed data hose.
UART: The classic serial.
See you on Day 24, where we will learn the language of chips: I2C Protocol.

Turn your Arduino into a robotics controller. Master the SG90 Servo Motor, understand closed-loop control systems, and build precise robotic joints.
Read More →
Give your robot eyes. Learn how the HC-SR04 Ultrasonic Sensor works, master the physics of sound, and build a precision Parking Sensor using Arduino.
Read More →
Master the Mechanical Relay. Learn how to control desk lamps, fans, and heavy appliances using an Arduino. Understanding NO, NC, and Galvanic Isolation.
Read More →